Ace Alliance Riga
Ace Alliance Riga
Don’t miss the Early Bird Offer! | August 6-7, 2026
Get Your Pass!
Table Of Content :

World Cup iGaming Index: Why Market Demand Doesn’t Follow the Bracket

trust
Ace Alliance: Delivering Trust Through Expertise
From exclusive events and interviews to real-time market trends, Ace Alliance brings you unbiased, well-informed, and data-driven content. Our editorial team adheres to strict editorial standards, ensuring that the information you receive is not only relevant but also trustworthy.

Built by market experts hosting events since 2023, with our first event in Riga, Latvia gathering over 300 top level iGaming industry executives, Ace Alliance is able to provide you with reliable information from direct interaction with experts and leaders in the sector.
Darko Ilievski
Lead Editor
Yagmur Canel
Content Manager
Updated:
Reading Time: 8 minutes
Blask x Ace Alliance World Cup iGaming Index report banner.

Blask analysed Index data for every nation that played in the 2018 and 2022 FIFA World Cups. The numbers point to a clear gap between football performance and iGaming demand. Brazil entered the 2022 World Cup with a Blask Index of 181M. Croatia entered with 5.9M. Brazil left in the quarter-finals. Croatia knocked them out on penalties.

That same pattern appeared across both tournaments. The countries with the strongest iGaming demand didn’t always go deep into the competition, and the teams that reached the final didn’t always come from the largest betting markets. For operators, that matters. World Cup campaigns built around tournament favourites can miss the markets where demand already exists.

Report

What the Blask Index Measures

The Blask Index is derived from Google Keyword Planner data and Google Trends. It measures branded demand volume: how often people in a country search for iGaming operators by name. It does not track generic searches for “online betting” but searches for specific brands.

Think of it as a gauge for consumer iGaming intent in a country at a given time. It can show demand signals before they appear in financial reports. That makes the Index useful in wider discussions around data transparency in iGaming, especially when operators compare market demand with revenue, campaign activity, and brand visibility. What it doesn’t measure is how good the national football team is.

For this study, Blask pulled monthly data for the participating nations across two periods:

That gave us one month before each tournament, the tournament period itself, and one month after. The aim was to see whether iGaming demand moved with the football calendar, the national team’s performance, or wider market conditions.

World Cup 2018: England was number 1, but France Won

The table below ranks markets by their Blask Index in June 2018, the peak month of the group stage (June 14–28). It also shows the MoM percentage change from May to June. In other words, how much each market jumped at the moment the tournament began.

Country Jun 2018 Blask Index MoM (May→Jun) Tournament Result
England 39,6M +18.5% Semi-final (4th)
Nigeria 12,6M −10.7% Group stage
Germany 11,3M +43.2% Group stage
Colombia 9,6M +44.1% Round of 16
Russia 8,8M +29.0% Quarter-final
Spain 8,5M +12.7% Round of 16
France 6,3M +28.7% 🏆 Champion
Croatia 3,2M +8.2% 🥈 Finalist

A few things immediately stand out. England had the largest iGaming market by a significant margin (39.6M versus Germany’s 11.3M), yet finished fourth. France, ranked seventh by the Blask Index, won the tournament. Germany and Colombia posted the two biggest MoM% jumps at kickoff (+43.2% and +44.1%) and exited in the group stage and Round of 16, respectively.

Monthly Demand Changes Didn’t Predict the Bracket

The chart below shows monthly iGaming demand changes during the 2018 World Cup period by national team market. Some markets jumped sharply, while others declined, but the movement did not map neatly to tournament performance.

WC 2018 iGaming demand MoM change by national team market.

The MoM% column tells the sharper story. It shows how each market reacted when the tournament started, and that reaction was a poor predictor of how far the team went.

In several markets, demand jumped at kickoff, then dropped once the national team exited:

Market Kickoff Spike Post-Exit Drop
Belgium +65.1% −23.1%
Poland +52.0% −20.6%
Germany +43.2% −22.8%

Volatile Markets Rose and Fell With Their Teams

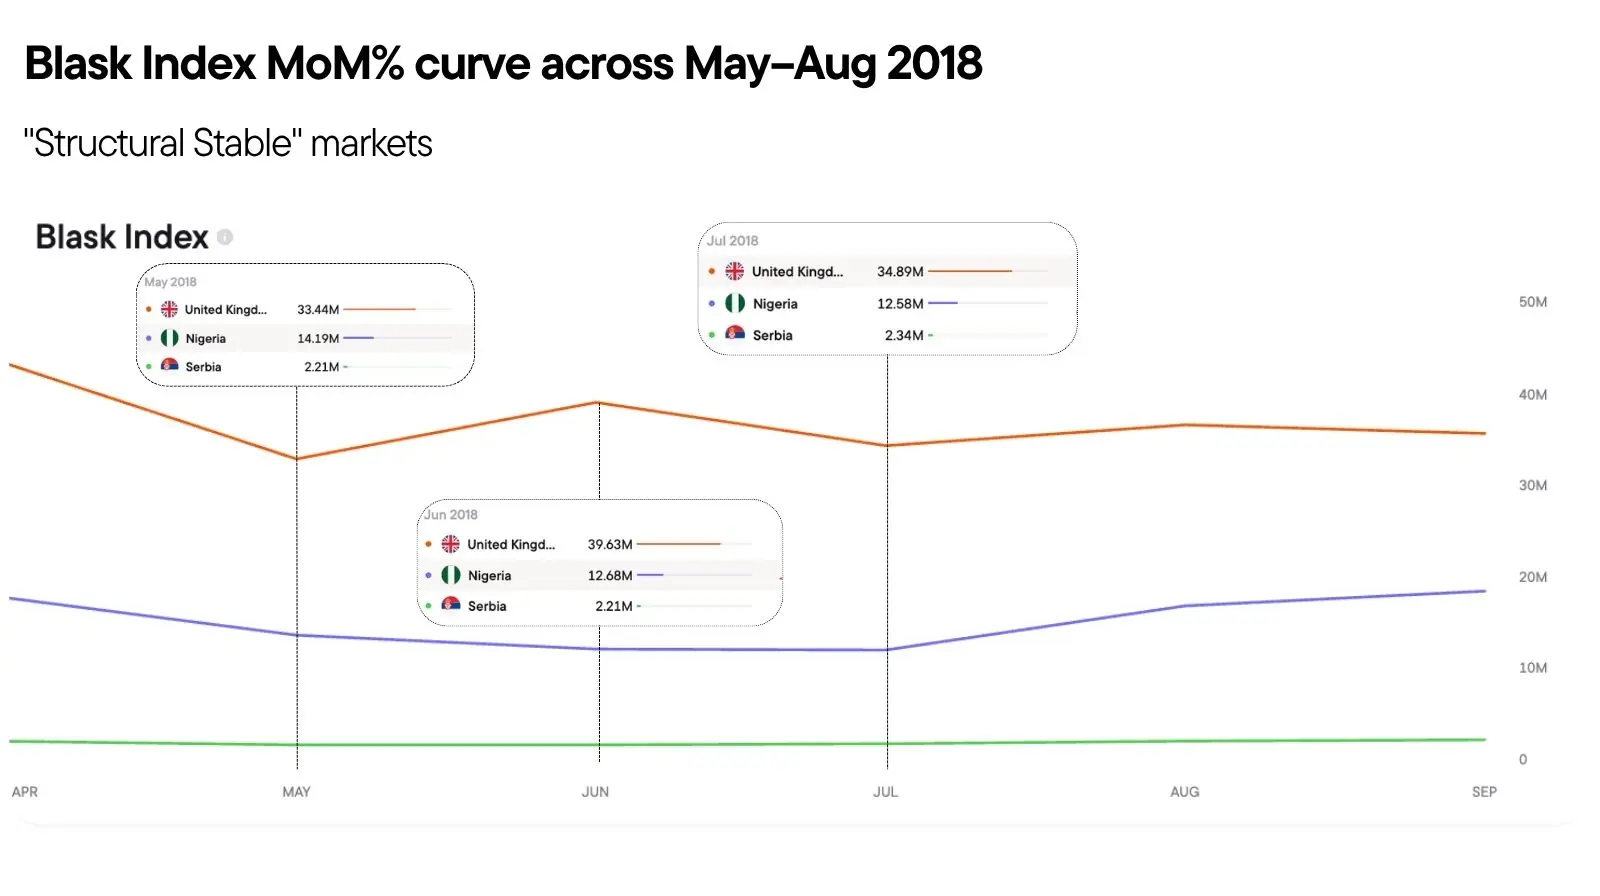
The next chart shows that pattern across the full May–August period for selected tournament-volatile markets.

Blask Index MoM% curve across May-Aug 2018 for tournament-volatile markets.

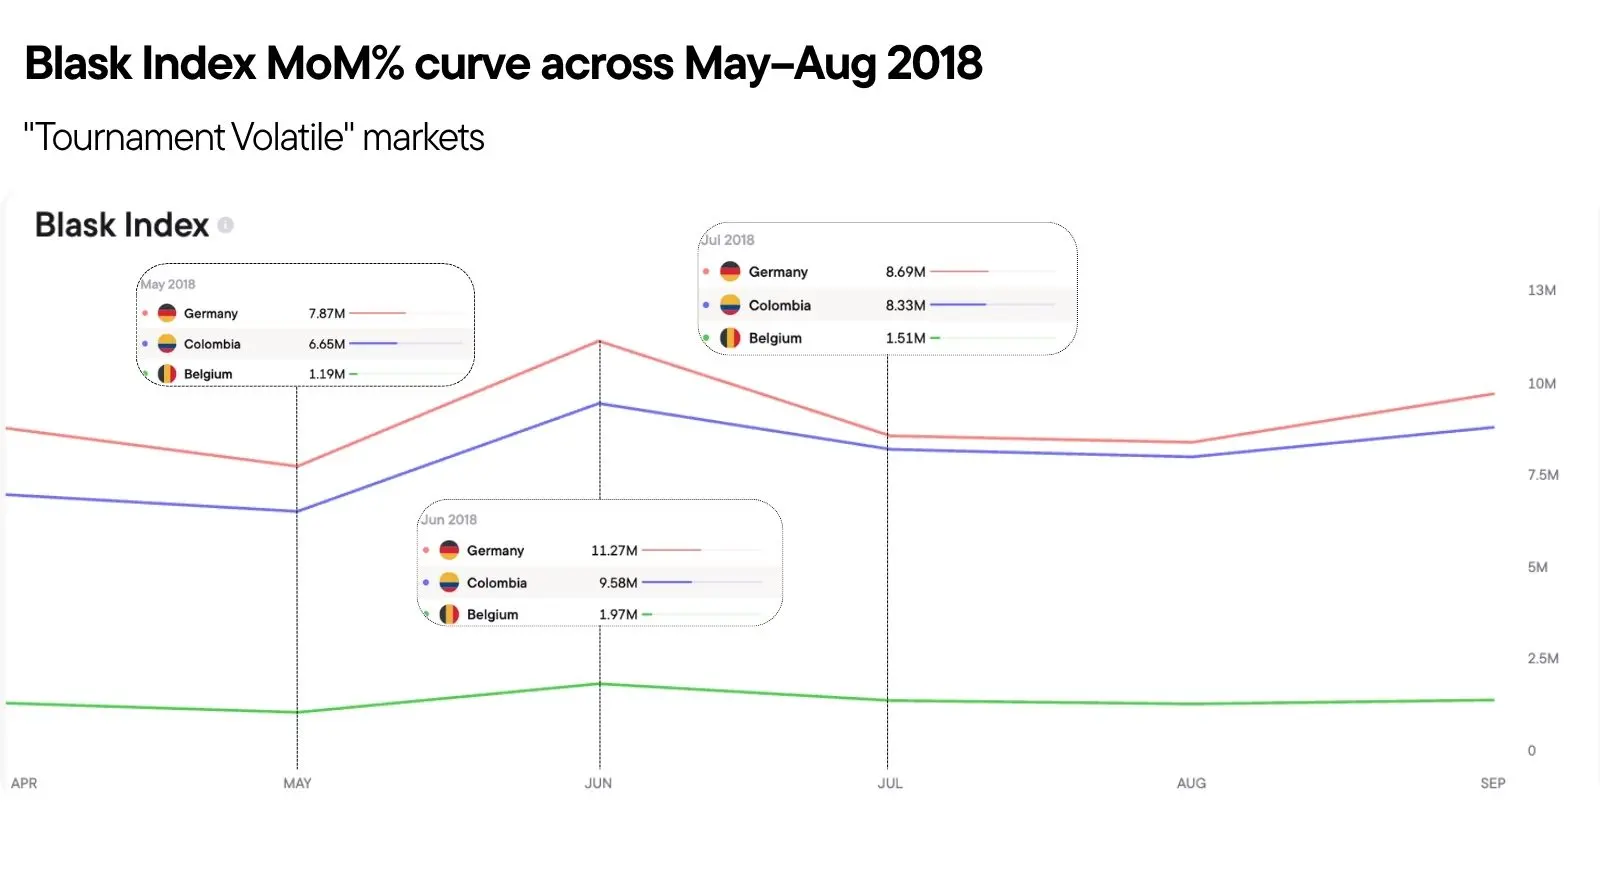
The volatile markets show a clear tournament-linked pattern. Demand rose when the competition opened, then contracted after elimination. For operators, that kind of movement creates a short activation window. The market reacts quickly, but the lift does not last.

France and Croatia Had a Different Demand Pattern

Croatia and France behaved differently. Croatia reached the final with a +8.2% kickoff spike, one of the smallest in the dataset. France won with +28.7%. Their markets didn’t need the excitement of an opening match to generate demand, as they had a structural floor that held regardless of the tournament calendar.

Blask Index MoM% curve across May-Aug 2018 for structurally stable markets.

Post-Tournament Growth Came From Outside the Bracket

The post-tournament numbers add another layer. After the July 15 final, three African markets posted their strongest numbers of the entire period, even though all three teams had already exited in the group stage.

The largest Jul→Aug growth came from:

These movements didn’t follow the tournament calendar. The markets were growing for structural reasons, including expanding internet access and increasing operator presence, while the World Cup was running in the background.

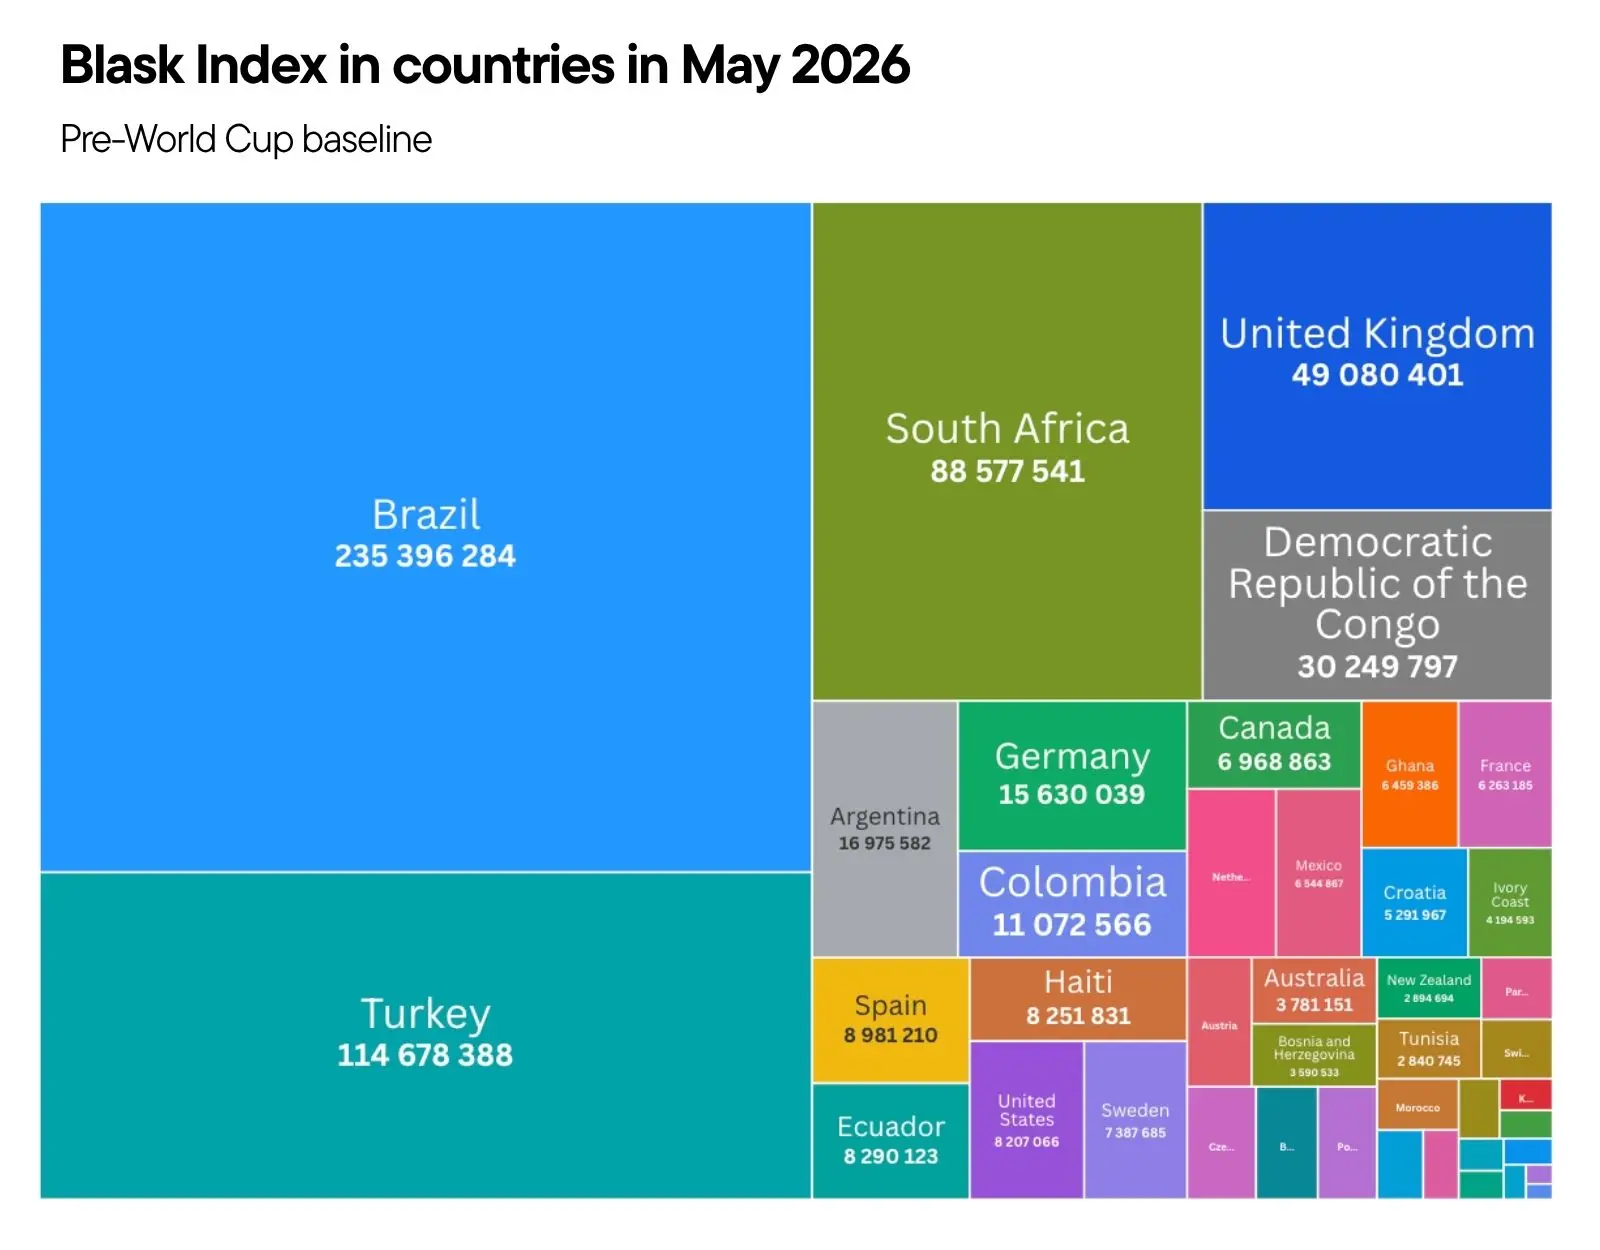
World Cup 2022: Brazil Was #1, but Argentina Won

2022 takes the same pattern and makes it more extreme. Brazil’s Blask Index in November 2022 was 181M. The United Kingdom was the next largest market and reached 43M on the Blask index. To put that gap in perspective: Brazil’s lead over second place was larger than England’s entire Blask Index.

Image displaying Blask index in countries in November 2022.

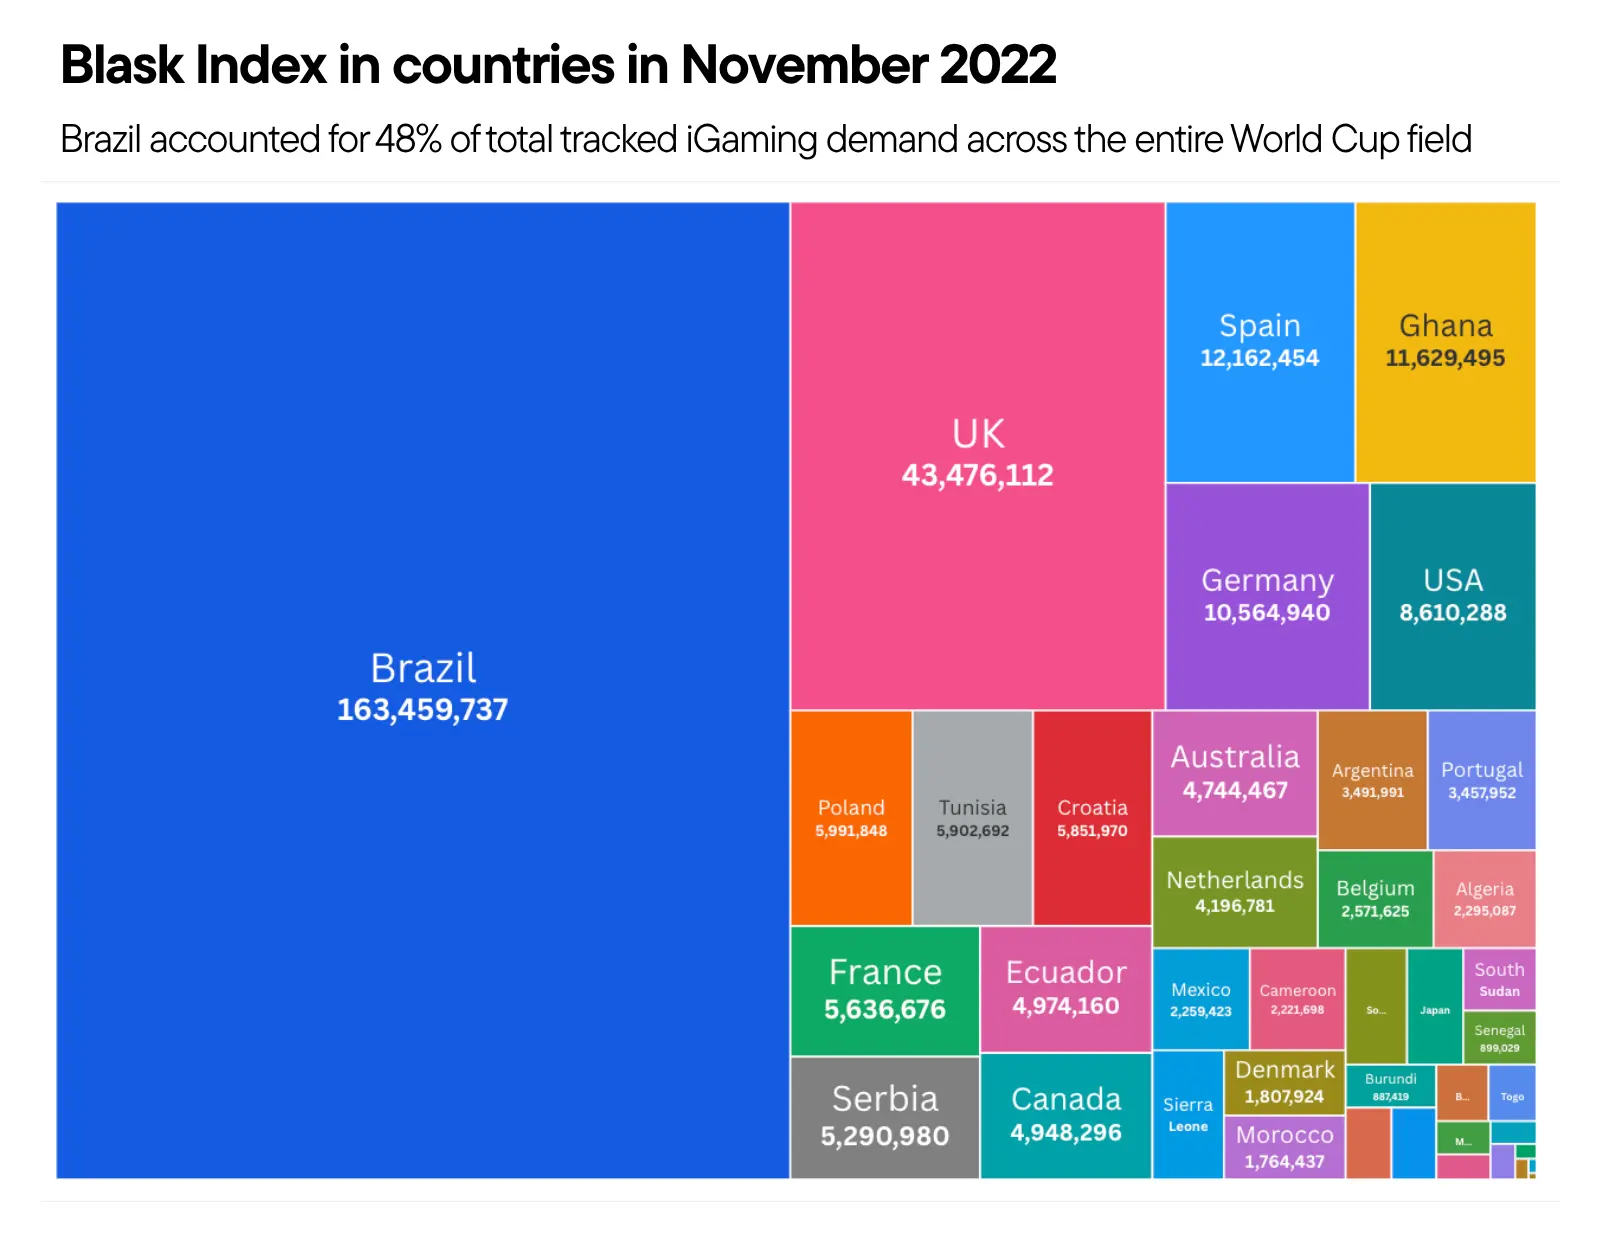
Brazil were widely considered favourites for the tournament. They lost to Croatia on penalties in the quarter-finals. Argentina, with a Blask Index of 4M in November (2.2% of Brazil’s), won the trophy on December 18.

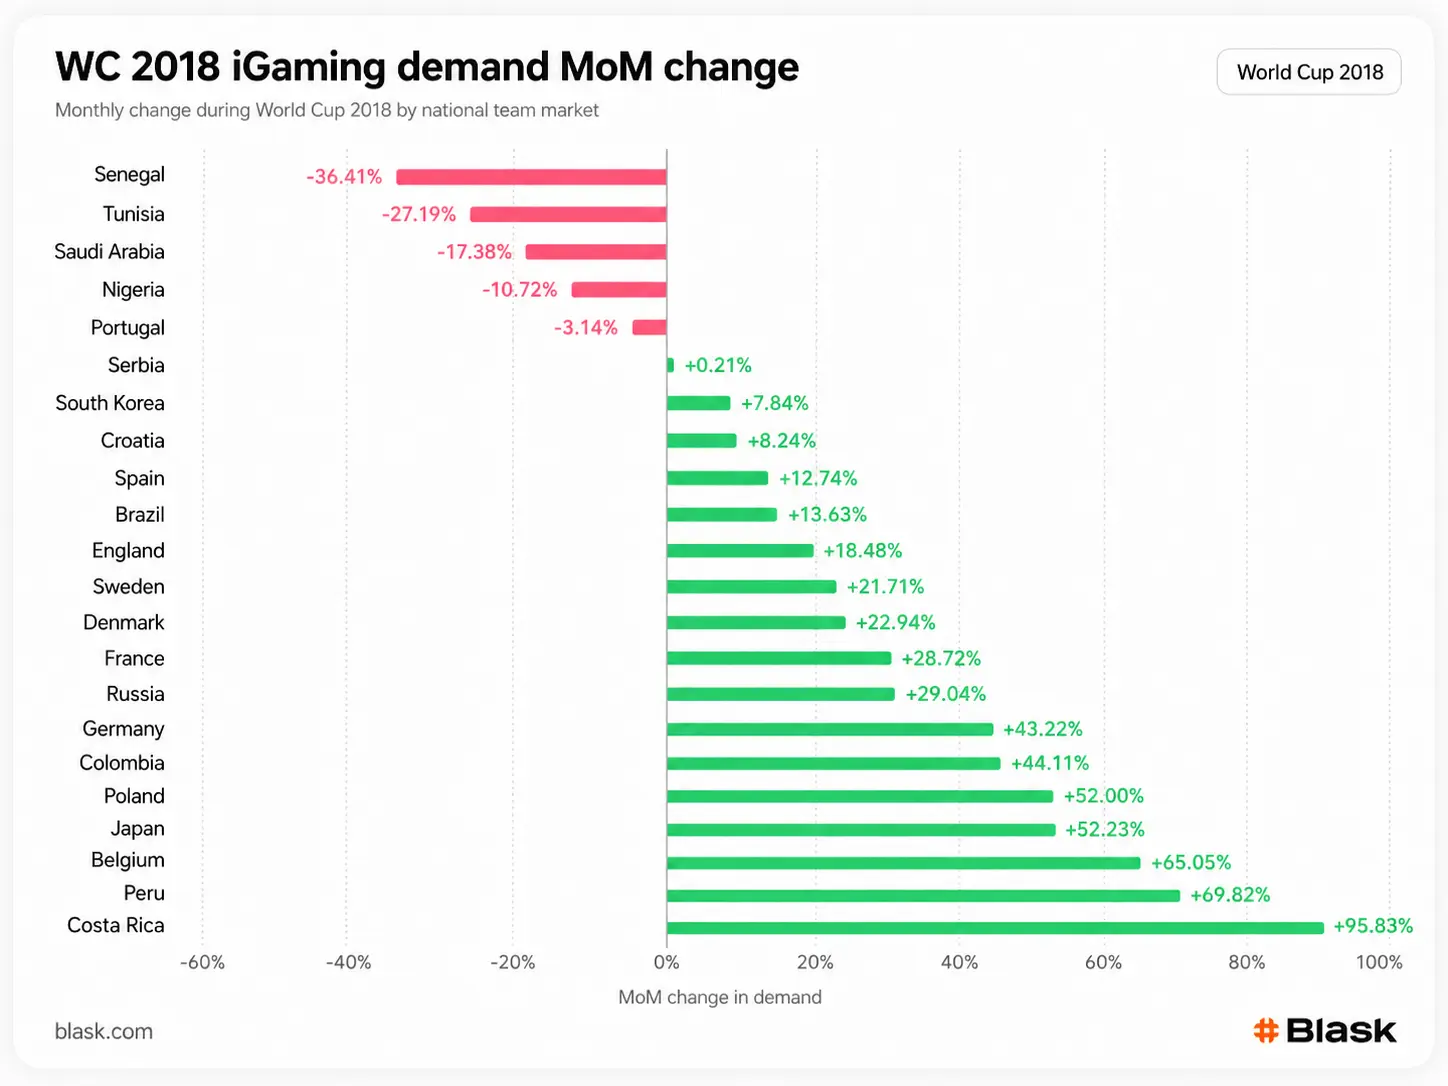
The Kickoff Spike Repeats

The MoM chart shows how iGaming demand moved when the tournament began. Positive numbers mean demand grew that month; negative numbers mean it contracted.

Image displaying the WC 2022 iGaming demand MoM change.

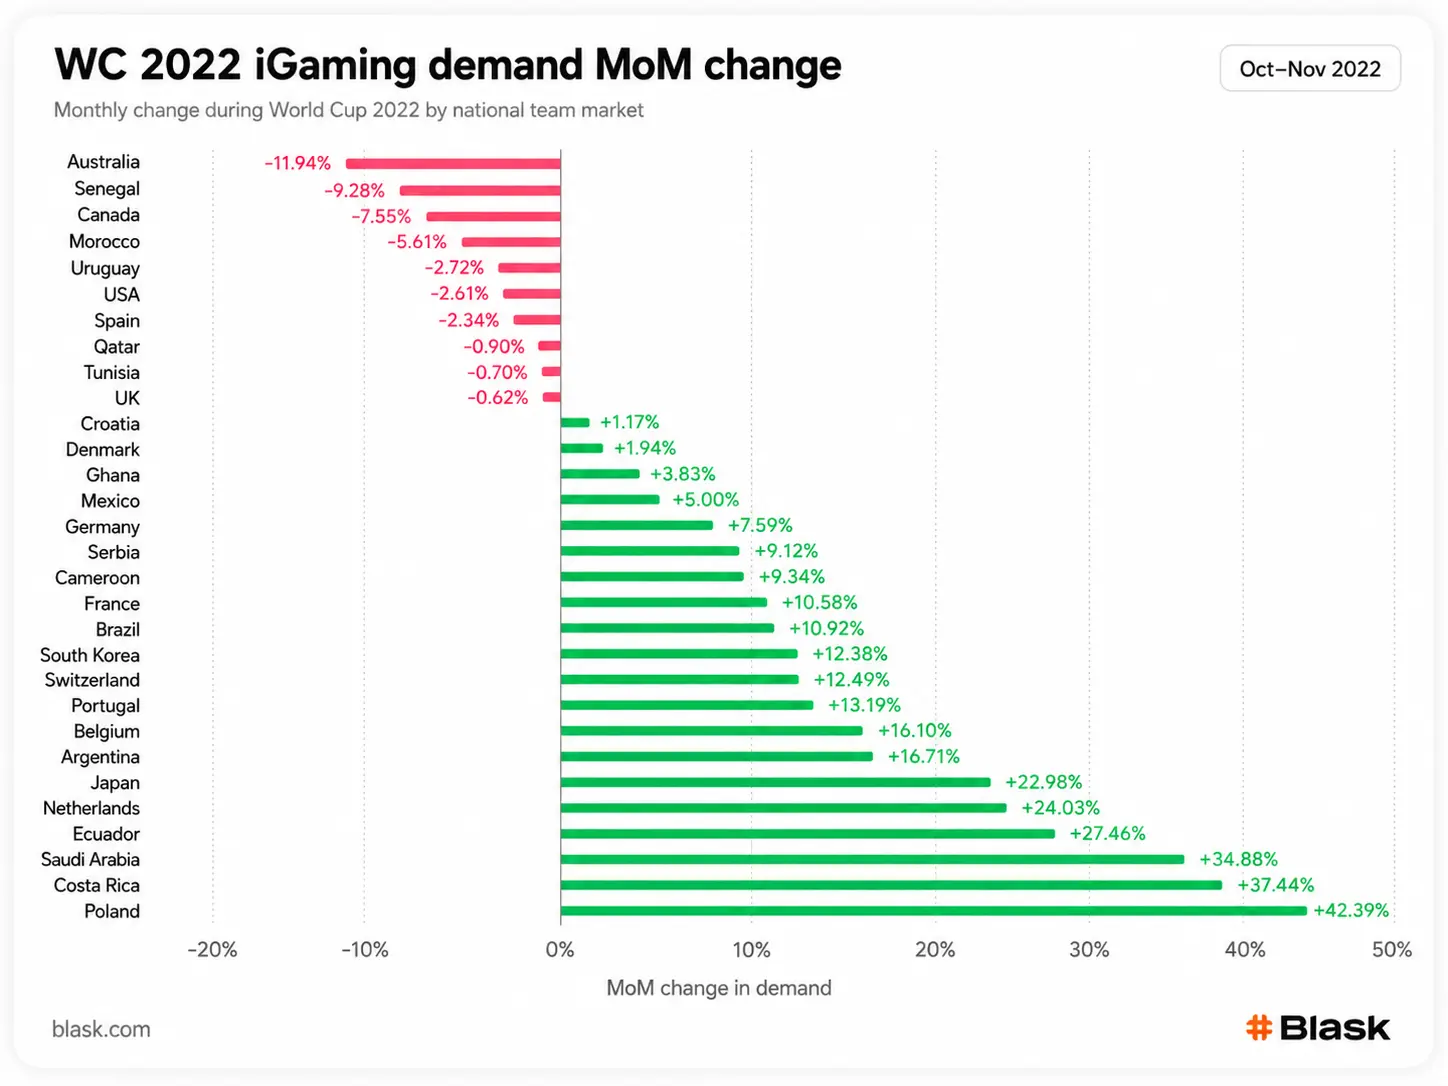
The kickoff spike pattern from 2018 repeats. Poland spiked +42.4% when the tournament opened and exited in the Round of 16. Ecuador opened the tournament on November 20 with a 2-0 win over host Qatar, spiked +27.5%, then dropped −29.4% by January after finishing third in their group. The team’s early success didn’t sustain demand once they were eliminated.

Selected Market Movements During and After the Tournament

The table below shows MoM movements for selected markets across the full period: Oct→Nov, Nov→Dec, and Dec→Jan. It also shows each country’s tournament result. Positive numbers mean iGaming demand grew that month; negative numbers mean it contracted.

Country Oct→Nov Nov→Dec Dec→Jan Tournament Result
Poland +42.4% −17.8% −16.0% Round of 16
Ecuador +27.5% −9.6% −29.4% Group stage
Netherlands +24.0% −5.4% −8.7% Quarter-final
Japan +23.0% +10.9% −18.4% Round of 16
Argentina +16.7% −3.1% −7.3% 🏆 Champion
France +10.6% −2.3% −11.6% 🥈 Finalist
Croatia +1.2% −5.9% −1.9% 🥉 3rd place
Morocco −5.6% −4.5% +3.4% 4th place
UK −0.6% +3.2% −2.7% Quarter-final
Spain −2.3% −1.4% −0.1% Round of 16
Uruguay −2.7% −31.6% −11.0% Group stage

Three Markets Tell the Clearest Story

Three markets in the table show why football results and iGaming demand don’t always move together.

  1. Morocco posted −5.6%, −4.5%, +3.4% across the four months. During that same period, they beat Spain, beat Portugal, and reached the semifinals, the furthest any African nation has gone in a World Cup. Their iGaming market declined throughout. A historic tournament run produced no measurable demand signal. This is the clearest example in the dataset of what we mean by decoupling: the football result and the iGaming market operating in completely separate dimensions.
  2. United Kingdom posted −0.6%, +3.2%, −2.7% across four months, through a quarter-final run. Essentially flat. The UK market at 43M baseline is structurally so large that a tournament doesn’t register as a meaningful percentage shift—the World Cup moves absolute volume but not the growth rate.
  3. Cameroon grew every month: +9.3%, +7.9%, +2.5%, despite going out in the group stage. Their market was expanding independently of the tournament. Like Nigeria and Senegal in 2018, the structural drivers of growth — population, mobile access, new operators entering the market — had their own momentum.

One outlier worth noting: the USA posted +20.2% in Dec→Jan, the only market in the dataset to spike after the tournament ended. The US team was eliminated December 3, losing to the Netherlands. The January number is NFL Playoffs driving sports betting activity. It’s a reminder that for US audiences in 2022, football still meant something different from what happened in Qatar.

What Actually Drives the Blask Index

After looking at both tournaments, four factors explain market size and none of them is the quality of the national squad.

Regulatory Framework

The UK sits first or second in both tournaments because the Gambling Commission spent 25 years building a market where brands can advertise, players trust operators, and the licensing infrastructure supports high-volume competition. Iran and Qatar (both participating nations) returned negligible or null Blask Index figures. No regulatory framework, no consumer market. The football participation is irrelevant.

Timing of Legalisation

Brazil’s 2022 dominance is a direct product of the 2018 legalisation. The legal opening brought hundreds of operators in. They spent four years building brand recognition, and that brand recognition shows up as Blask Index. The compounding effect of legal access plus aggressive marketing plus a large connected population took four years to reach 181M. The math is straightforward.

Population Size and Digital Access

Nigeria’s 2018 numbers come from 141 million internet subscriptions and a young, mobile-first population, not from their group-stage finish. Ghana’s 2022 showing (12M in November, comparable to Germany) follows the same logic: large connected population with an established betting culture.

Depth of Gambling Culture

Colombia (6.6M in May 2018), Serbia (2.2M), and Croatia (3.0M) all outperform their population size because betting is socially normalised and structurally embedded. These aren’t markets that need a major tournament to activate. Betting is already part of the sports-watching experience.

3 MoM% Patterns and What Each One Means for Operators

Looking across both tournaments, markets fall into one of three patterns. The pattern tells you more about the right campaign strategy than the tournament bracket does.

Type 1: Volatile Activator

These are markets where iGaming demand follows the national team’s tournament status closely. When the team is still playing, demand rises sharply. When the team exits, demand drops at a similar pace. Germany in 2018 jumped +43.2% at kickoff, then fell −22.8% the following month. Poland in 2022 followed the same pattern: +42.4% at kickoff, then −17.8% and −16.0% in the two months after. The activation window is real, but narrow. Operators targeting Volatile Activators need to be live early, especially during the first two weeks of the group stage. After that, the curve can start moving against them.

Type 2: Structural Flatliner

These are large, mature markets where iGaming demand is already deeply established. A World Cup can add volume, but it rarely changes the percentage movement in a major way. England in 2022 moved −0.6%, +3.2%, and −2.7% across the tournament period, despite reaching the quarter-finals. Spain stayed in low single-digit movement across both tournaments. Brazil posted +10.9% at kickoff in 2022, but that came on a 181M base. These markets are already saturated with demand. For operators, the stronger play is retention and share-of-wallet, rather than acquisition campaigns built only around tournament excitement.

Type 3: Independent Grower

These are markets where demand grows during and after the tournament without a clear link to team results. Nigeria in 2018 grew from 12.6M in June to 17.4M in August, a +38.4% Jul→Aug increase, after exiting in the group stage. Senegal grew +113.3% in the same period. Cameroon in 2022 posted +9.3%, +7.9%, and +2.5%, despite also leaving in the group stage. The growth comes from wider market conditions: expanding internet access, new operator entry, and younger demographics reaching gambling age. The World Cup can support brand discovery, but it isn’t the main driver.

WC 2026: the North American Wild Card

The United States, Canada, and Mexico host the 2026 World Cup. 3 markets at meaningfully different stages of iGaming development. The US began legalising sports betting state-by-state from 2018, the same year Brazil legalised, though with a more structured regulatory process. By late 2022, the US ranked sixth across the entire World Cup field. But the 2022 numbers represent a market that was only four years into its post-legalisation development. Mexico adds another regulatory layer to the 2026 picture, with lawmakers already calling for updated gambling laws before the 2026 FIFA World Cup.

Blask Index in countries in May 2026

Brazil’s Blask Index at WC 2018 was approximately 4.5M. Four years later, it was 181M. The US regulatory environment is more complex, and the cultural relationship with football (soccer) is different. But the post-legalisation compounding dynamic isn’t unique to Brazil. The US 2022 figure is a starting point, not a ceiling. The industry is already projecting WC 2026 at $60 billion in global stakes from legal bookmakers.

What This Means for Operators

The World Cup can create sharp changes in iGaming demand, but the data shows that operators should not plan campaigns around football results alone. Market size, regulation, brand demand, and timing all matter more than whether a national team is expected to reach the final. For some operators, that also means reviewing product setup, local acquisition routes, and the role of white label sportsbook providers before tournament demand peaks.

Target by Blask Index, Not by Bracket Expectation

Nigeria in 2018, Brazil in 2022, and Ghana in 2022 were large, underserved markets with strong iGaming demand. Yet many World Cup campaign plans would have overlooked them because their national teams were not viewed as likely medal contenders. The Blask Index shows where demand actually sits, rather than where the football narrative is strongest. That distinction matters for operators. Tournament favourites and iGaming market leaders are often different countries, so campaign planning should start with demand signals, not bracket expectations.

Launch Campaigns at Kickoff, Not at the Knockout Stage

Blask Index activity peaked in the first two to three weeks of both tournaments across nearly every market, regardless of which teams were still performing. By the time the Round of 16 started, demand in most markets was already past its high point. Campaigns built around “if our team reaches the quarter-finals” missed the strongest window. For operators, the group stage is the key activation period. That timing also matters for media buying, partner planning, and gambling affiliate networks, where late campaign launches can miss the highest-intent window.

Watch Regulatory Timelines, Not Squad Announcements

Every major Blask Index spike in this dataset points back to regulation or market maturation, rather than team performance. Brazil’s 2022 scale, the UK’s sustained dominance, and the US trajectory all reflect legal access, operator activity, and years of market development. France won in 2018 with a Blask Index around one-sixth of England’s. Argentina won in 2022 with a Blask Index equal to 2.2% of Brazil’s. Germany ranked third in 2018 and fifth in 2022, then went out in the group stage both times. The gap comes from regulation, population, and accumulated demand, not only ninety minutes on the pitch.